What Is an Airflow Visualization Device?
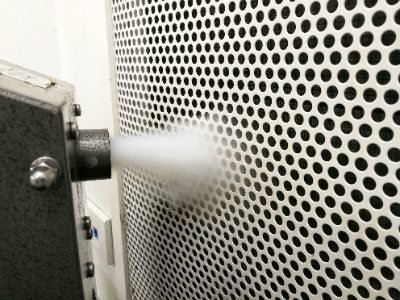
 An airflow visualization device is a device that generates a mist of pure water in the form of a fine mist and observes the mist as it moves with the movement of the airflow to enable visual confirmation of airflow conditions.
Gas visualization devices that are compatible with pure water do not require smoke or particles that could cause contamination, and are harmless to humans and machines because they use pure water and clean air. Therefore, it can be safely used in hygienic environments such as clean rooms.

Figure1. Overview of airflow visualization system
The speed at which mist airflow is generated is varied according to the application of the gas to be checked. Also, by adjusting the airflow rate at which the mist is sent out by a fan to minimize its effect on the airflow in the space, it is possible to expel the gases to be checked efficiently and visualize them more clearly.
Uses of Airflow Visualization Devices
Airflow visualization devices are used to check the airflow in a specific space. Specifically, it is used to identify the cause of defects, to check the turbulence and differential pressure in a room, and to check for backflow.
It is also used to check for upward airflow near heat sources. Generally, gas flow in the air cannot be seen. However, airflow visualization devices can be used to visually check the flow of gases in a space.
The device can also be used in sanitary environments, such as clean rooms, to check for airflow puddles or dust puddles caused by obstructions.
Principle of Airflow Visualization Device

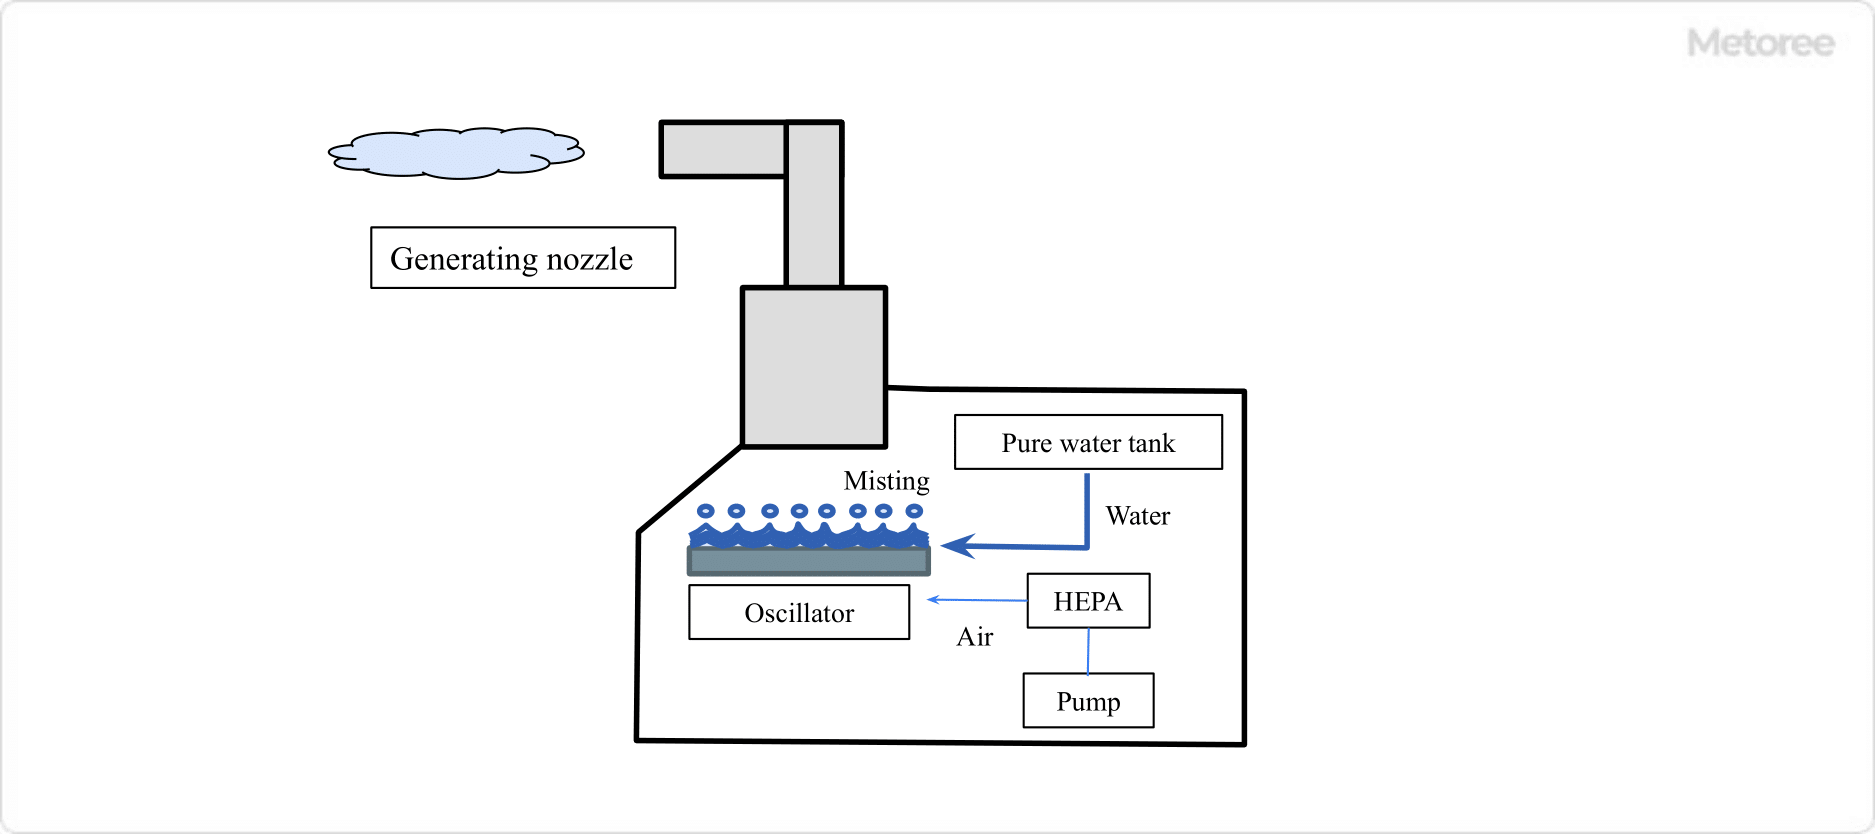
Figure 2. Principle of airflow visualization system
An airflow visualization device consists of an ultrasonic generator unit, a fan, a nozzle, a pure water tank, and other components. Ultrasonic waves generated by the ultrasonic generator unit cause vibrations that turn deionized water into a micrometric fine mist.
The mist is then pushed out by a fan, which sends the generated mist through the nozzle into the space. By adjusting the frequency of the oscillator, the particle size of the mist can be controlled. The mist is produced large enough to be seen with the eye, but small enough not to affect the flow.
Airflow visualization devices do not use smoke or particles that have some component in the substance they release into the air. Since it uses mist made of pure water in an atomized form, it can be used without worrying about contamination. In addition, because it passes through a HEPA filter, there are no foreign particles from the pump.
Other Information on Airflow Visualization
1. Airflow Visualization Methods

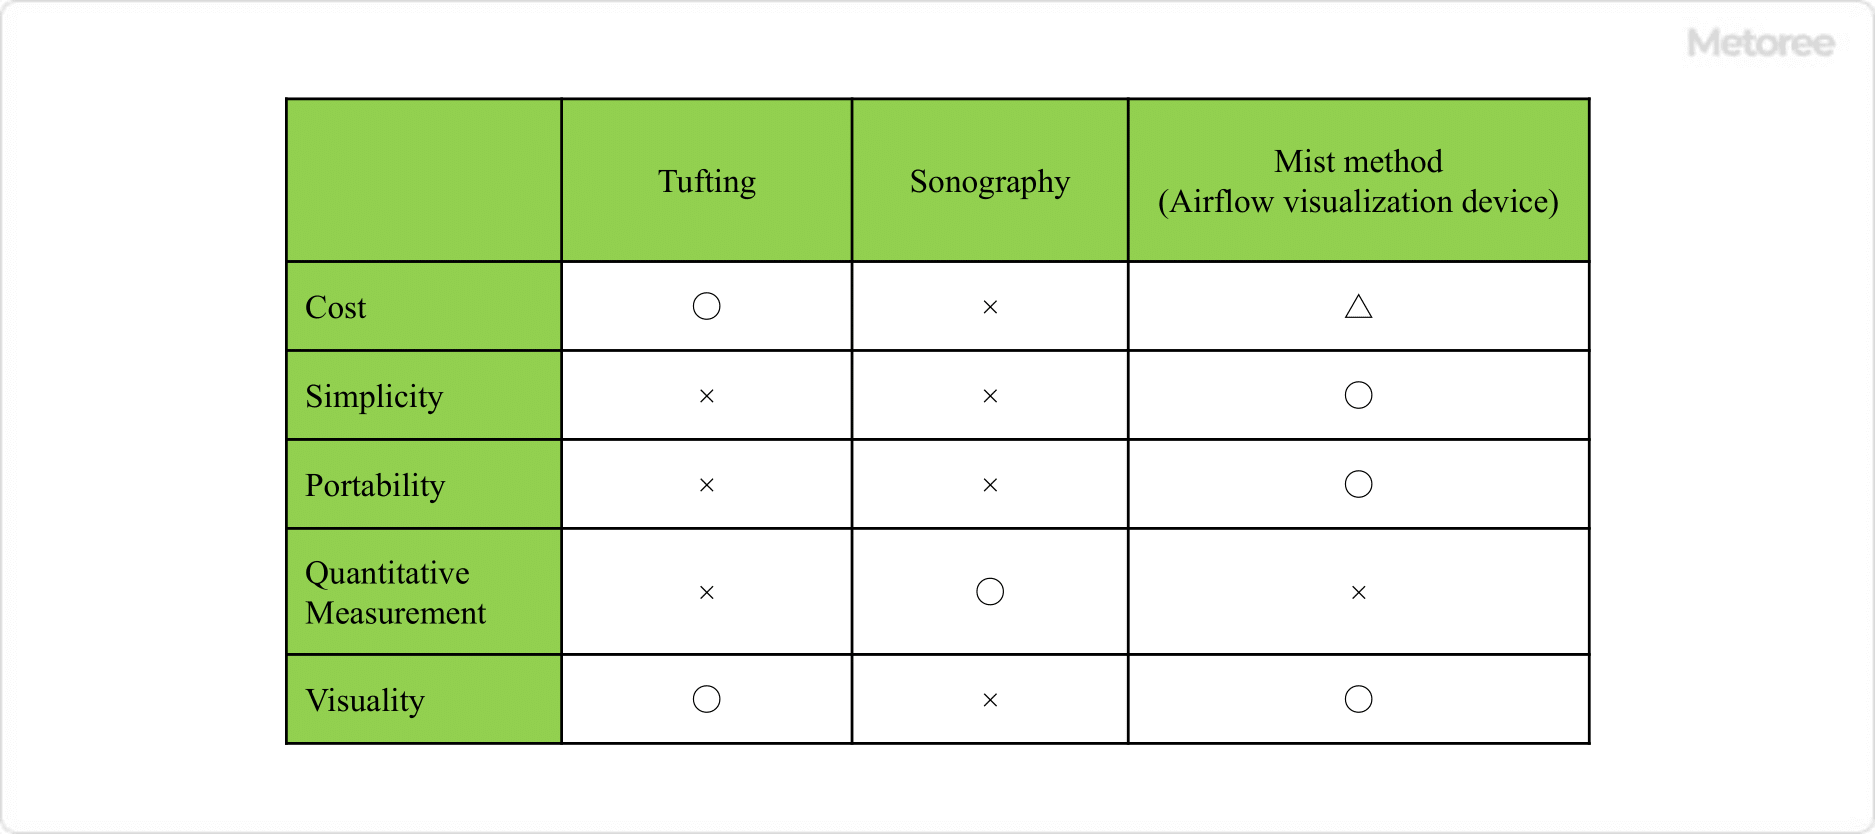
Figure 3. Airflow Visualization Techniques
In addition to airflow visualization devices, other airflow visualization methods include the tuft method and the ultrasonic method.
Taft Method
In the tufting method, a thread or other object is inserted into the flow and its behavior is used to investigate flow patterns, such as flow direction, non-stationary, and the existence of separation areas. This method is suitable for measurements in areas inaccessible to the human hand.
Ultrasonic Method
The ultrasonic method uses ultrasonic waves to measure flow velocity distribution by detecting Doppler signals from reflective objects in the fluid. It is a method that can quantify the flow field in a non-contact manner, but it is expensive and still has some usability issues.
All methods have their advantages and disadvantages, but airflow visualization devices (mist method) are relatively easy to use, portable, and can be used to take measurements as soon as they are within reach.
2. Measurement Device of Airflow Visualization Device
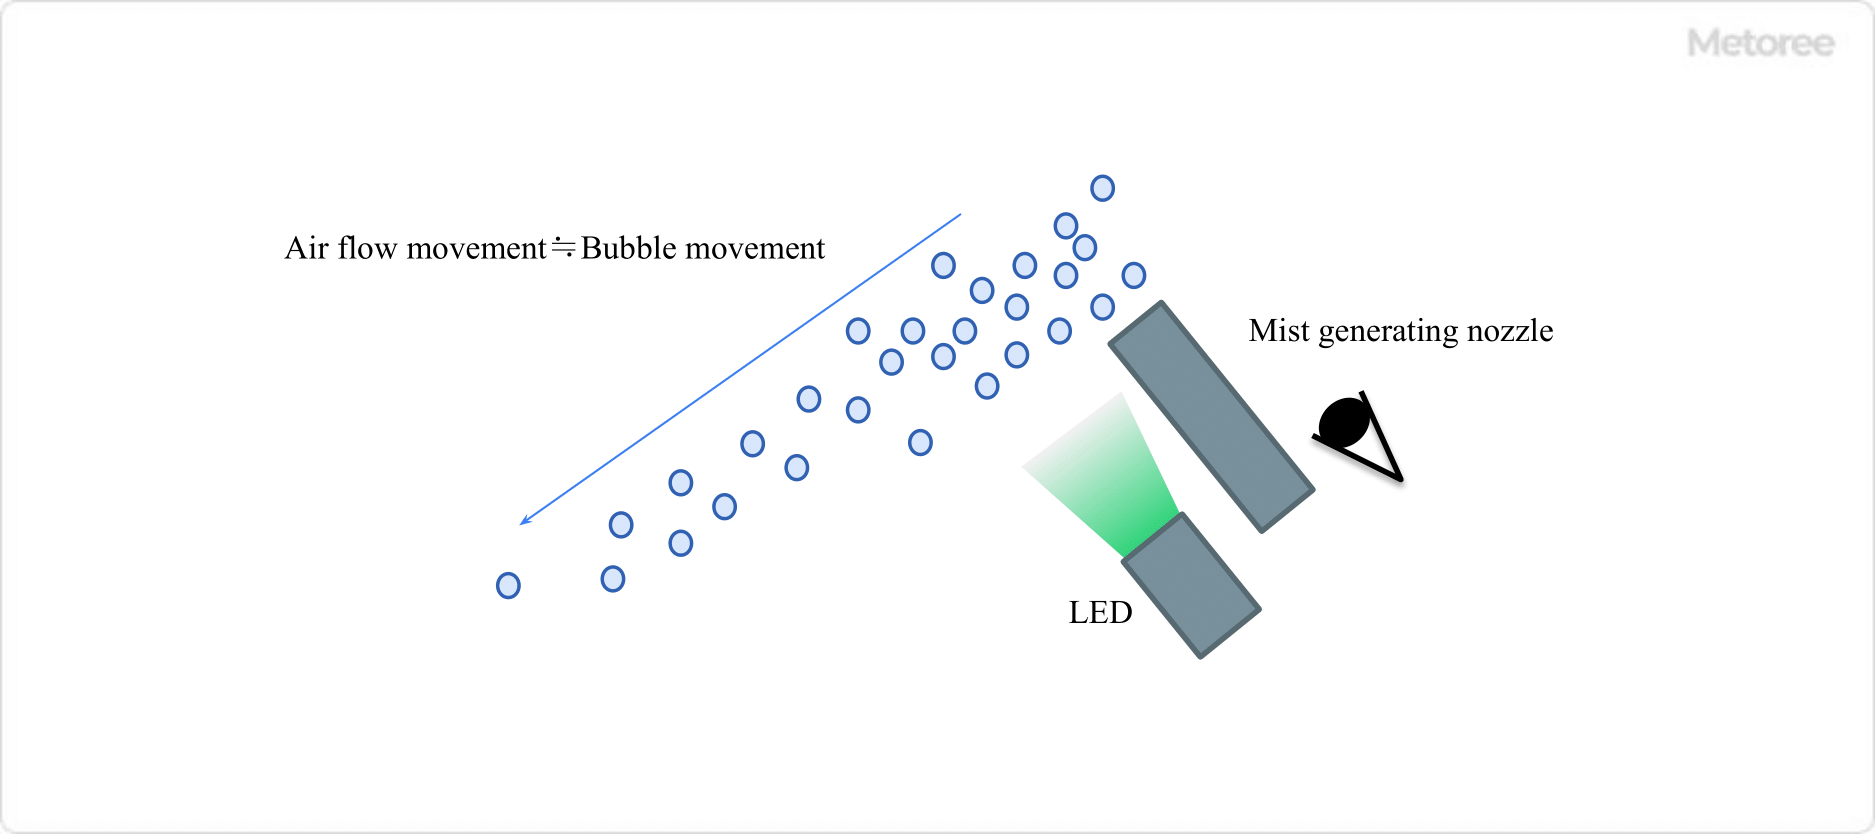
The particle size of the mist emitted by an airflow visualization device ranges from a few micrometers to 5 micrometers. Since it is difficult to see the mist in dark places, a bright light source is required. A powerful laser or LED light source is recommended.
In addition, the visibility may vary depending on the color. Most commercially available products are green, which is easy on the eyes and highly sensitive. Adding color may have the opposite effect if the brightness itself is reduced, so trial and error is recommended. The impression will vary greatly depending on the angle at which the light is shining and other factors.
In addition, if you want to record the flow field with a camera, you may need to make some adjustments to the camera as well. Recently, there is a technique called PIV, which attempts to quantify the flow field by combining video from a camera and image analysis. Although this method is not applicable to all cases, it is effective in some cases and should be considered.